Conversion Rate Optimisation
Research-led conversion optimisation — analytics, user testing and structured experiments that turn the traffic you already have into more enquiries and sales.
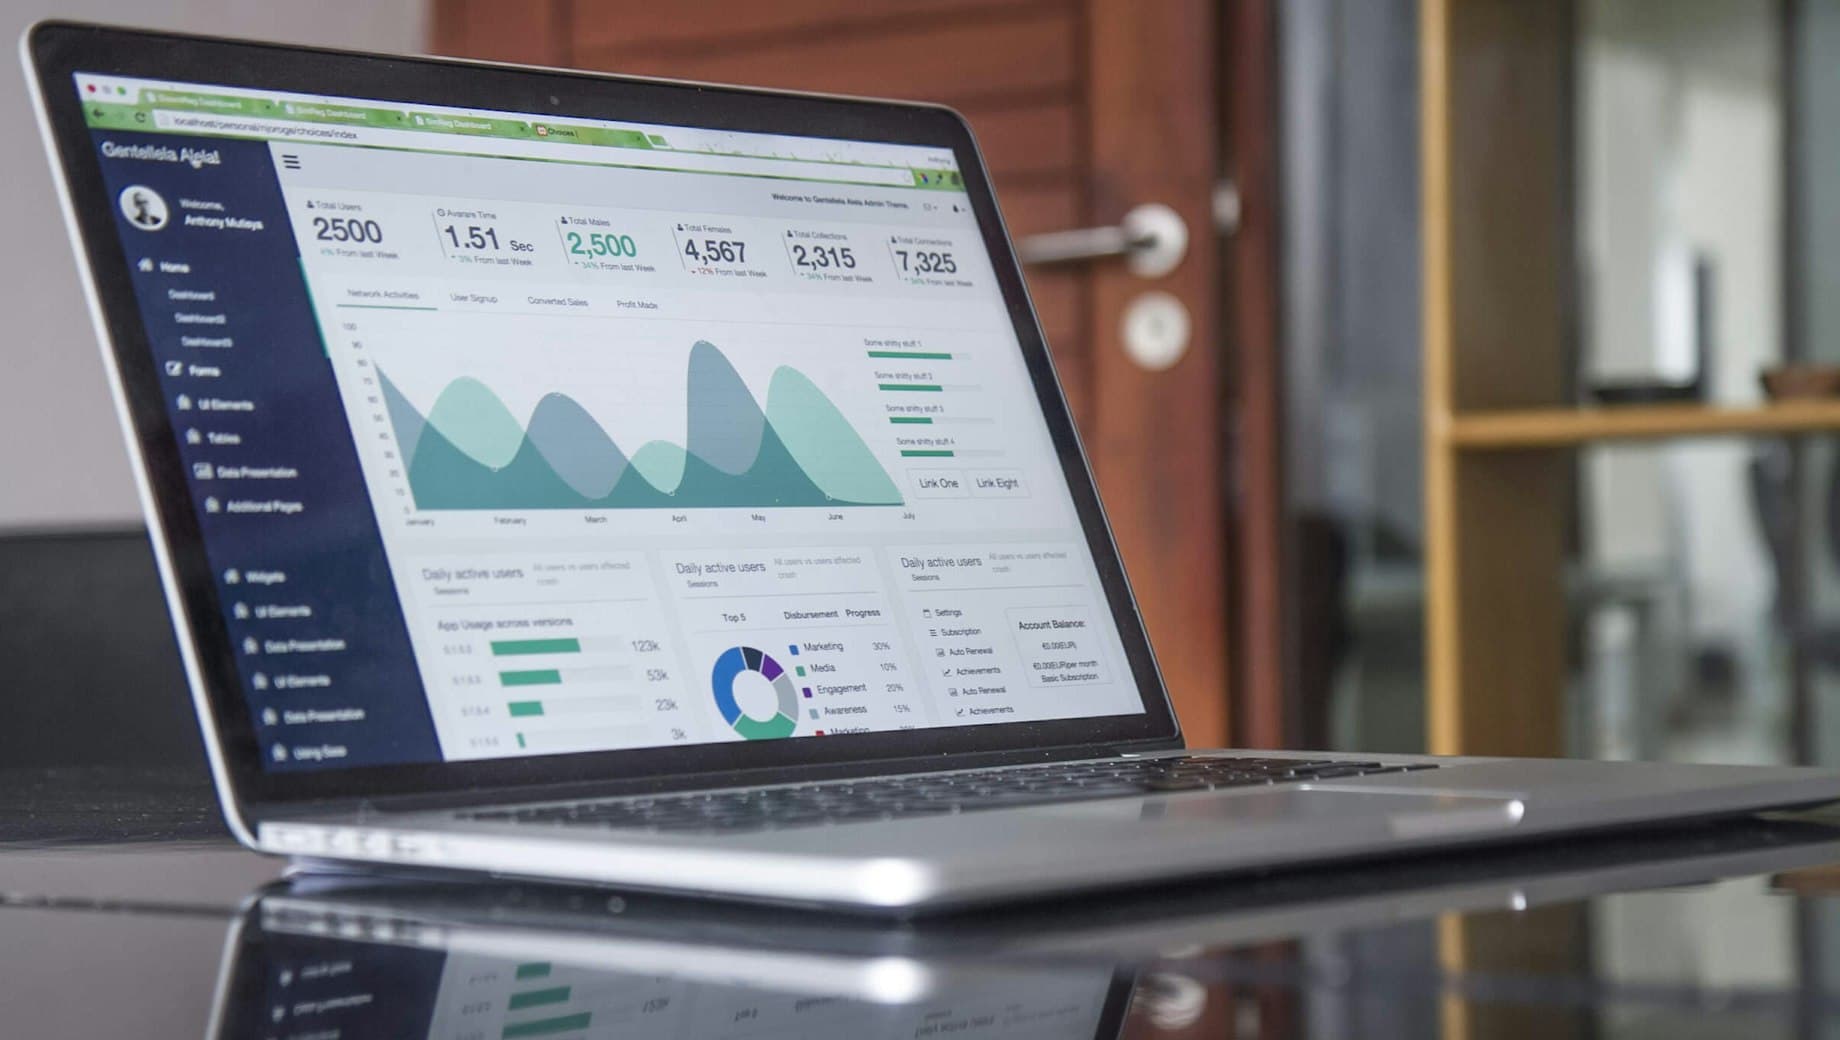
What you get
Conversion audit
A data-backed review of where visitors drop off and why — the leaks worth fixing first.
User research & analytics
Heatmaps, session recordings and funnel analysis so decisions rest on evidence, not opinion.
A/B testing programme
Structured experiments that prove what actually lifts conversion before you commit to it.
Implementation & reporting
The winning changes built and measured, with clear reporting on revenue impact.
How we work
Measure
We instrument the funnel properly and gather the analytics and user data the site is missing.
Diagnose
We find where and why visitors drop off, and rank the fixes by likely impact and effort.
Test
We run controlled A/B experiments so improvements are proven, not assumed.
Roll out
We implement the winners, then repeat — conversion optimisation is a cycle, not a one-off.
Why Conversion Rate Optimisation Pays
Most businesses spend to get people to their site — ads, SEO, social — and then quietly lose the majority of them to a page that was never built to convert. Conversion rate optimisation attacks the other side of that equation. Instead of buying more traffic, it turns more of the traffic you already have into enquiries, sign-ups and sales. Because the visitors are already paid for, every point of extra conversion is close to free growth, which is what makes CRO one of the highest-return marketing investments available.
The maths is stark. A site converting at 1% that reaches 2% has doubled its output with no extra ad spend. Achieving that is rarely one big change; it is a series of small, evidence-led improvements to the pages and steps where visitors decide whether to act — the headline they read first, the form they are asked to fill, the friction between wanting to buy and being able to.
CRO matters most where clicks are expensive and competition is fierce, because there a better conversion rate directly lowers your cost per acquisition and lets you outbid rivals who are still pouring budget into a leaking funnel.
Our Research-Led, Test-Driven Method
We do not redesign on taste and hope. Every engagement starts by measuring: we instrument the funnel properly, then gather the analytics, heatmaps, session recordings and user feedback that reveal where visitors actually drop off and why. That evidence turns a wish list of opinions into a ranked set of hypotheses — the changes most likely to move the numbers for the least effort.
From there we test. Wherever traffic allows, changes go live as controlled A/B experiments so we can prove an uplift rather than assume it, protecting you from the confident redesign that quietly makes things worse. Winners are rolled out and become the new baseline; losers teach us something and are discarded. Then we repeat, because conversion optimisation is a compounding cycle, not a single project with an end date.
- Funnel instrumentation and analytics that actually track what matters
- Heatmaps, session recordings and user research to find the real friction
- A ranked hypothesis backlog by expected impact and effort
- Controlled A/B testing to prove uplift before rollout
- Winning changes implemented cleanly, with revenue-focused reporting
What to Expect, and When CRO Is Not the Answer
A typical engagement opens with a conversion audit — a fixed-scope diagnosis of your biggest leaks and the fixes worth prioritising — which stands alone or becomes the first month of an ongoing programme. On a running programme we work in test cycles, and we report in the only terms that matter: conversion rate, enquiries and revenue, not vanity metrics. You always know what we changed, what it did, and what comes next.
We are honest about the prerequisites. CRO needs enough traffic to reach statistical confidence; below roughly a few thousand visitors a month, formal testing takes too long, so we focus on best-practice fixes and qualitative research instead. And if the real problem is that the wrong people are arriving, we will say so — no amount of optimisation fixes a mismatch between your traffic and your offer, and pointing that out is part of the job.